 Economist watch: Farewell to the Arctic is one of the headlines on the front cover of the April 29th edition, and The Arctic as it is known today is almost certainly gone is one of the leaders. Which is sort-of nice, to see it so prominently and starkly.
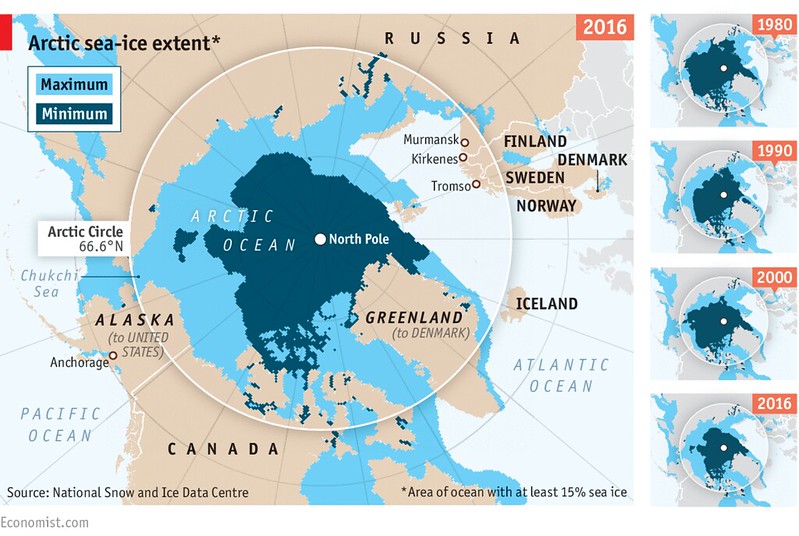
THOSE who doubt the power of human beings to change Earth’s climate should look to the Arctic, and shiver. There is no need to pore over records of temperatures and atmospheric carbon-dioxide concentrations. The process is starkly visible in the shrinkage of the ice that covers the Arctic ocean. In the past 30 years, the minimum coverage of summer ice has fallen by half; its volume has fallen by three-quarters. On current trends, the Arctic ocean will be largely ice-free in summer by 2040.
The pic is nicked from yet another article, The decline of Arctic sea ice. In which I find
OVER the past three decades the area of sea ice in the Arctic has fallen by more than half and its volume has plummeted by three-quarters. So says a report “Snow, Water, Ice, Permafrost in the Arctic” (SWIPA), produced under the auspices of the Arctic Council, a scientific-policy club for the eight countries with territory in the Arctic Circle, as well as observers including China and India. SWIPA estimates that the Arctic will be free of sea ice in the summer by 2040. Scientists previously suggested this would not occur until 2070.
You just knew I was going to quibble that 2040, didn’t you? I think we need to look at www.amap.no/swipa2017. When I first checked an hour or two ago it appeared to be f*ck*d so here’s an archive since it’s now working. Who are these people and why have I never heard of them? Wiki hasn’t either, and the urban dictionary is at best a rough guide. I guess we want the SPM from which:
The Snow, Water, Ice and Permafrost in the Arctic (SWIPA) assessment is a periodic update to the Arctic Climate Impact Assessment, published in 2005 by the Arctic Monitoring and Assessment Programme (AMAP), the Conservation of Arctic Flora and Fauna (CAFF), and the International Arctic Science Committee (IASC). SWIPA focuses on changes to the Arctic cryosphere (the portion of Arctic land and water that is seasonally or perennially frozen), and the implications of those changes. The first SWIPA assessment was conducted between 2008 and 2010, and was published in 2011.
Aanyway, unlike the IPCC SPM’s the SWIPA SPM doesn’t reference it’s statements back to where they come from, so it’s no use to me. Oh, but The results of the SWIPA assessment are presented in reports, targetting different audiences. The results of the 2017 SWIPA assessment are currently available in a Summary for Policy-Makers and series of Fact Sheets. The detailed technical background that is the basis for the other reports will be availble [sic] in the summaer [sic] of 2017. That’s just a touch disappointing, and I’m not referring to their inability to speak English, which I’ll forgive since I can’t manage a word of Norge. The fact sheets are empty.
Well, without something to back up the 2040 claim you can colour me unconvinced for the while.
Refs
* Hammering the Trend – Tamino.

In a long view, the Arctic is likely doomed. Eocene like atmosphere implies an Eocene like climate. Is there a reasonable counter argument?
“When?”, meaning the first year the Arctic is ice free for a month, or also for an entire year, is a much harder question to answer. I’ve not seen any convincing claim.
LikeLike
“Doomed” sounds so final. I mean, even if there’s no ice, it will still be The Arctic, yes?
[At work, we prefer to say “gently curved on top” -W]
LikeLike
Ah, just think of the future warm bright summer nights by the warm Arctic Ocean for a get away from the staggering heat everywhere else. Palm trees and all. Call the resort Eocene Nights.
LikeLike
Not to excuse the lack of references in the report, but linear extrapolation of the PIOMAS September volume gets one to zero a bit before 2040.
[True. And if you extrapolate past that, it turns negative 🙂 -W]
LikeLike
#4, sure, PIOMAS zero ice volume well before 2040, about 2031. But:
1) The variation of PIOMAS over 3 standard deviations gives a range of ice out from ~2018 to 2044. If we get lucky, will be past 2040. If really not lucky, might see first “ice free” this year. So why “before 2040”?
2) Why a linear extrapolation on modeled volume? Why not on sea ice extent or area? Why linear?
3) Why not a climate/ice model such as this?
http://psc.apl.washington.edu/zhang/IDAO/z_movie_heff_proj_summer.mpg
Not that the answer from climate models is any more convincing until climate models can reproduce Eocene climate with Eocene climate forcing atmosphere (about 1400 PPM CO2) and slightly fainter sun.
LikeLike
IPCC does the same with SPM first, full report later. I’m sure that was the model, probably for the same reason.
[But IPCC SPM provides refs to detail, and of course the draft full reports are available, so the same problem doesn’t arise -W]
LikeLike
If one buys into the theory of Arctic Amplification then a linear trend would have to be considered conservative.
[I’m missing your logic here. Why? -W]
PIOMAS April numbers are out and we see a huge drop below the previous record low: 2017 Day 120, 20.640 km^3. 1.642km^3 below previous low for day (2011 Day 120, 22.282 km^3). Anyone having followed this winter’s ridiculous Freezing Degree Day numbers is not surprised: http://sites.uci.edu/zlabe/files/2017/05/dmi_fdd_anomalies_80N.png
This means it’s more and more likely that Maslowski’s “virtually ice-free” by 2016 +/- 3 years prediction will see its fruition this fall.
[Really? Wanna bet? -W]
LikeLike
WC writes: [Really? Wanna bet? -W]
Sure, but I assume you’ve forgotten Maslowski’s prediction was that 80% volume was his definition of ‘virtually ice-free”.
Since he made his prediction others have gotten into the game and they use a different definition.
[Ah, if this isn’t the std area-based defn then I’m not interested until I’ve examined it more carefully -W]
LikeLike
[See https://en.wikipedia.org/wiki/Talk:Artificial_intelligence/Archive_1#Arthur_T._Murray -W]
LikeLike
“Really? Wanna bet?”
My estimate of odds this summer are around 0.001% to 1%. I doubt if Dr Connolley would take a 100:1 bet, and I think fair odds are longer shot than that for this summer.
Odds of ice out summer should rise with time. If PIOMAS is basically correct, and linear extrapolation is roughly correct, then somewhere around 2022 the cumulative odds are near 10%. By about 2028, the cumulative odds are near 50%. By 2031 the yearly odds will be roughly even. Other methods mostly give later dates. While Dr Connolley and I have have been chatting in various forums for over 20 years, I doubt if he would make a 11 year bet. I’m not sure I would as well.
Now #8 might have different opinions.
LikeLike
Std area-based definition.
LikeLike
Sure, but I assume you’ve forgotten Maslowski’s prediction was that 80% volume was his definition of ‘virtually ice-free”.
Appllied to physical antropology of the skull tong school, , the equation [ 80% volume = virtually ] would explain most of the comments in the blogosphere
LikeLike
Similarity to IPCC seems to be they got the pols to sign off on the SPM before the report was finalized. It would appear they’re actually producing the report itself post-SPM. I think this is better since it doesn’t build a huge lag into the process.
Phil, was that for the September average?
LikeLike
#13 Difference between minimum day volume and minimum month average volume is much smaller, about an order of magnitude, than the volume variation between years. Matters for a bet, doesn’t matter much for trying to understand what the future might look like.
LikeLike
http://www.amap.no/swipa still advertising an event which is 4-6 May 2011. Hmm. seems to say a lot about them.
80% of what?
https://thinkprogress.org/arctic-death-spiral-naval-postgrad-schools-maslowski-projects-ice-free-fall-by-2016-3-yrs-8451a607c916
‘By “ice-free,” Maslowski tells me he means more than an 80% drop from the 1979–2000 summer volume baseline of ~200,00 km^3’
To get a number near 20,000 km^3 for 1979-2000 I find that using June July and August dates and PIOMAS data I get an average of 20.56 k km^3.
Lowest 3 years so far 2012 9.935 2011 10.373 and 2016 10.765.
2017 is starting from about 1.8k km^3 less than previous lowest and maybe that gap will grow due to albedo effect. However, 9.935 down to 4.112 to get 80% volume loss from 1979-2000 20.56 seems a big ask and seems unlikely to happen even with this year being really low.
Perhaps he meant a different period like Oct-Nov or a different dataset?
William, should you be rushing to grab the bet rather than not getting around to figuring it out?
[I don’t understand, which is one reason for not jumping on this. If M’s baseline is 200 k km^3, and you think we’re down to 10 k km^3 already, something is wrong. So is the answer that Romm has screwed up his digits and his 200,000 should read 20,000? -W]
LikeLike
Yes the 79-2000 average is near 20,000 not 200,000. So it is a misplaced comma not a missing 0. i.e. 200,00 means 20,000 not 200,000.
[Hmm, seems legit. Yes, the only way to get 20 k km^3 for the early period does seem to be JJA. KON, are you still there? Are you wanting to bet on the low side of less than 80% of 20k, i.e. 4 k km^3, for JJA average for 2017? Or if not that, then what? I’m guessing you don’t, because it’s pretty hard to see the average of (June, 0, 0) being under 4k -W]
LikeLike
He was not talking a 3 month average, but the end of summer minimum. In 2012 we fell just shy (78% ?).
[Could you be precise? If I look at http://psc.apl.uw.edu/wordpress/wp-content/uploads/schweiger/ice_volume/BPIOMASIceVolumeAnomalyCurrentV2.1_CY.png I’d by-eye the black blobs at 12k for September, in which case 80% loss is 2.4k. That doesn’t look like a reasonable bet for the high side -W]
LikeLike
There does seem to be confusion between fall in heading and summer in quote.
It could well have been Oct+Nov which I get 1979-2000 to average 16.467. Seem to remember someone was using Oct+Nov and maybe PIOMAS numbers got redone at some point. Anyway if it is 20% of Oct Nov then 20% of 16.467 = 3.293 k km^3. Lowest so far was 2012 at 6.629
So if 1.8k km^3 gap for April 2017 grew to 3.336 then Maslowski’s ice free definition would be met. Maybe just about possible.
September hasn’t been close to 20k km^3 and I make it that 2012 got to 72.8% reduction from 13.916 to 3.789. I very much doubt Maslowski would be using daily minimum rather than a 1, 2 or 3 month average.
I am now more inclined to think it was Oct Nov.
LikeLike
A different possible bet, Jim Pettit writes
http://forum.arctic-sea-ice.net/index.php/topic,230.4213.html
“I’ll place money on the certainty that 2017 will move below 2016 within the next eight weeks, and stay there for some time.”
(based on IJIS https://ads.nipr.ac.jp/vishop/#/extent )
[As a bet, that doesn’t look interesting. I guess we’re back to “opinions don’t differ enough to make betting worth while” -W]
LikeLike
Maslowski’s paper referred to October-November:
“Given the estimated trend and the volume estimate for October–November of 2007 at less than 9,000 km3, one can project that at this rate it would take only 9 more years or until 2016 ± 3 years to reach a nearly ice-free Arctic Ocean in summer. Regardless of high uncertainty associated with such an estimate, it does provide a lower bound of the time range for projections of seasonal sea ice cover.”
The reference value was about 22,000 in the ’90s (his data shows the decline starting in 1997).
LikeLike
>[As a bet, that doesn’t look interesting. I guess we’re back to “opinions don’t differ enough to make betting worth while” -W]
You seemed to believe that tends in area/extent were better than using volume.
[Perhaps that they are more familiar. And certainly they are more strongly observationally based; I know little of PIOMAS or how much I should trust it. Also, its alone: unlike the area / extent, which many centres provide -W]
Is there a test of that with this years low volume at maximum? If it is the volume trend that matters we should expect the 1.8 k km^3 volume below previous lowest to grow over the melt season due to albedo effects. (I.e. thinner ice melts out quicker allowing albedo to fall faster, more heat absorbed by ocean that can melt more ice.) If it is area or extent that shows a more consistent trend as you have seemed to indicate you believe then as we get down to low volumes shouldn’t that volume get harder to melt and so the gap to previous lowest should shrink towards the end of the melt season?
[Yes, that’s kinda what I think. I also think that the volume “matters” less. For the climate, what really matters is the albedo, to first order; which is a function of area, to first order -W]
I am not sure why you believe this and you haven’t seemed able to explain. Perhaps bathymetry effects?
Anyway do you believe the gap to previous lowest volume will shrink towards the end of the melt season. Could there be a bet about this to test the idea?
[Unfortunately I don’t have a strong opinion on that. I think it likely that the gap will shrink, yes. I’d even put money on that, just to formalise things -W]
I suspect I won’t disagree with you enough to bet but maybe others will be interested to see if you propose anything.
Do let me know if I am mis-characterising your views or drawing unwarranted conclusions about your beliefs.
LikeLike
Thank you for your comments above. I am certainly interested to see whether the gap shrinks late on in the melt season and think that is entirely possible and perhaps more likely than not.
LikeLike
Couple of polls:
http://forum.arctic-sea-ice.net/index.php/topic,2035.0.html
Volume gap to previous lowest to shrink late in melt season?
No, gap will increase mainly due to albedo effects 5 (17.2%)
Yes, gap will shrink as remaining ice gets harder to melt 10 (34.5%)
No idea or opinion 4 (13.8%)
Gap to stay similar 5 (17.2%)
No gap will increase mainly for reasons other than albedo
4 (13.8%)
Other (please explain) 1 (3.4%)
10:9 for yes gap will shrink seems evenly split. Given venue I am surprised it isn’t a clear no.
http://forum.arctic-sea-ice.net/index.php/topic,2031.0.html
When will be break PIOMAS 2012 September record?
2017 (In General) 56 (63.6%)
2018-2019 1 (1.1%)
2020-2023 4 (4.5%)
2022-2025 1 (1.1%)
2024-2027 0 (0%)
2026-2029 0 (0%)
2028-2030 0 (0%)
After 2030 0 (0%)
Never 2 (2.3%)
2017 by month: July 1 (1.1%)
2017 by month: August 8 (9.1%)
2017 by month: September 15 (17%)
80:8 for 2017 seems pretty overwhelming for 2017. No surprise there.
[A record breaking year seems at least likely; I too am surprised by the gap-closing bit -W]
LikeLike