 So: “Scientific Perspectives on the Greenhouse Problem” by Jastrow, Nierenberg and Seitz, published by the Marshall Institute, has turned up. Now I have to read it. I got mine from abebooks, if you’re interested.
One thing to note is that it was published in 1990, and so has access to IPCC ’90: they explicity acknowledge this in the preface, and ref it in chapter 1. I’m expecting that to be relevant, excuse-wise.
Preface: largely neutral; small “skeptic” slant due to over-emphasis of uncertainties.
Chapter 1 – reliability of the predictions
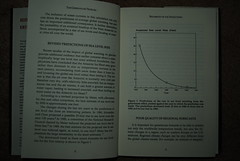 All is going fairly sanely until Bang! Suddenly, on p8/9, an outbreak of pencil-up-the-nose madness: they present the picture I’ve inlined, and the text “The changes during the last ten years in the predictions of sea level rise form an interesting pattern… The downward trend is shown in Figure 1.” Even if those 3 data points were honest (and they aren’t) the curve-fitting they have done is invalid. But the data points aren’t honest, they are:
* 1979: 25 over 150 years
* 1985: 3 in an unspecified time period
* 1989: 1 in 50 years
Clearly, the very least you could possibly do would be to reduce these to the same time period. Using the time-base of 1979, that would mean trebling 1 to 3 for the 1989 point (which would then make it no change since the 1985 point, badly denting their theory. Assuming the 1985 point is a vaguely comparable timeframe). But that isn’t good enough either: SLR isn’t usually linear in these projections, it gets faster into the future as the world warms. So their data use here is so blatantly dishonest I’m astonished at their brass necks.
But that is not all, oh no that is not all. The 1979 25 foot value is from Schneider and Chen. I don’t have access to that, but happily it is referenced by the IPCC AR4 thus: Near-total deglaciation would eventually lead to a sea-level rise of around 7 m and 5 m (***) from Greenland and the WAIS, respectively, with wide-ranging consequences including a reconfiguration of coastlines worldwide and inundation of low-lying areas, particularly river deltas (Schneider and Chen, 1980; Revelle, 1983; Tol et al., 2006; Vaughan, 2007). So, as you would expect: the 25 foot value is assuming deglaciation of the WAIS and Greenland and is not comparable to a value projected to 2050 only which would have assumed little or no contribution from these sources. This too is dishonest, although less blatant, since it is slightly harder to spot.
And their third point of dishonesty over this figure is their omission of any number of other estimates. For example, the Nierenberg report (1983; gosh, I wonder if any of them had ever heard of that?) guesses 70 cm (~2.2 feet) in 100 years – but adding that in would have spoiled their beautiful smooth curve. And IPCC ’90 gives 66 cm for B-a-u, in 1990, so using just those two points would have been flat from 1983 to 1990. Which really wasn’t what they wanted to see.
And after that we’re back to sanity: probably over-emphsises uncertainty (a phrase I’m clearly going to need a lot, so abbreviated to OEU) at the expense of what was known, but compared to the outbreak of madness above, it is much better.
Chapter 2. Clouds and the greenhouse problem
By contrast, I can’t see anything mad in this chapter. Again, it OEU but apart from that seems OK.
Chapter 3. Greenhouse forecasts compared with observations
As you’d expect, this suffers from the same problems as Jastrow, Nierenberg and Seitz vs Hansen and so is unsalvagable (the Energy article is from 1991, and the book from 1990, so presumably came first; either way, for some reason they were sufficiently proud of this drivel to want to re-publish it, which is amazing). There is some other stuff in that chapter, but I don’t think it is interesting, other than perhaps to note that they quote D V Hoyt as the source of the assertion that NH aerosols haven’t been increasing. This allows them to rather casually dismiss aerosols as a possible cause of the 1940-1970 cooling, as they put it. IPCC ’90 (to which JNS had access, remember) cites a number of studies for the increase in aerosol (section 1.8.1). JNS just use Hoyt, which is to say Hoyt, D. V., 1979. Atmospheric transmission from the Smithsonian Astrophysical Observatory pyrheliometric measurements from 1923 to 1957. J. Geophys. Res., 84, 5018-5028, errm, and I think you can see the problems there. So, once again, selective use of the wrong sources whilst ignoring the right sources wins the day, hurrah.
I think that is enough for one day. If my strength doesn’t fail me, I may manage to press on a bit further tmorrow.
[Update: well, there is more but it is much the same. So I’ll leave it at that.]


